Setting up a NUC for ETH Staking - Ubuntu, Nethermind, Lighthouse, Prometheus, Grafana
I am super intrigued by Proof of Stake and what it means for the future of Ethereum. I have missed the Genesis launch of ETH2 but I figured I'd have a play on the Goerli testnet just out of intrigue.
The reason I have avoided ETH2 thus far is because:
- I've been busy
- This is new software that hasn't been battle tested in an environment with real world economic incentives.
- It costs nearly $20,000 to take part (as of right now - 3rd December 2020)
Now.. I work in software, work with Ubuntu daily, have a lot of experience with this kind of stuff, and generally think I am well placed to get involved with this kind of cutting edge technology.
That said, one of my major concerns is the number of people seemingly getting involved without the required technical proficiencies. Given that the premise of Proof of Stake is that you lose money if you do it wrong, I find this quite bemusing. I think lots of people are going to get hurt.
As with a lot of my blog posts, I wrote this all down so that I can remind myself what I did and when. Given the nature of the software involved it is highly likely that developers will be moving fast (and hopefully not breaking things), so a thorough understanding of all the moving parts, and an in-advance upgrade process is a must.
Hardware
- Intel® NUC Kit NUC8i7BEH
- Crucial CT32G4SFD8266 32 GB
- Samsung MZ-V7S2T0BW SSD 970 EVO Plus 2 TB M.2 Internal NVMe SSD
- Samsung MZ-76E2T0B / EU SSD 860 EVO 2TB 2.5 Inch Internal SATA SSD
- USB Stick - 16GB+
- USB Keyboard
Setting Up
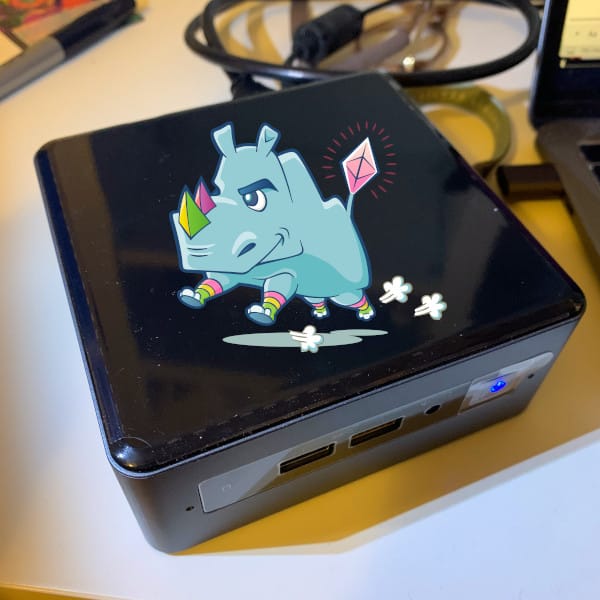
I installed the two hard drives and the memory in the NUC.
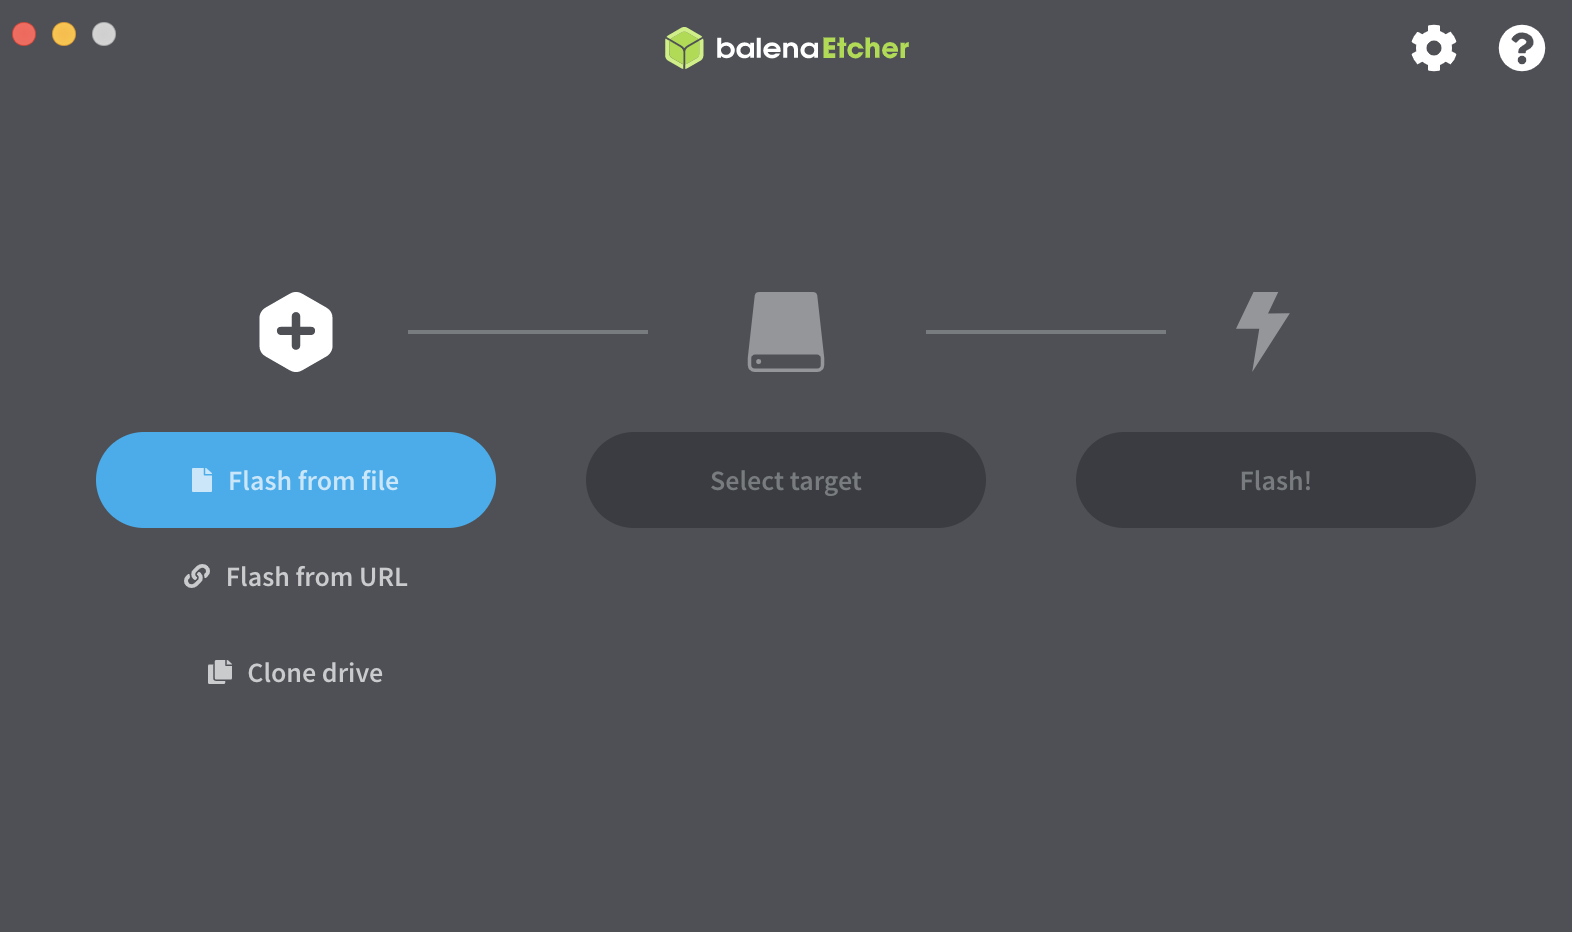
I downloaded the Ubuntu Server 20.04.1 LTS ISO. I used Etcher to flash the ISO to my USB stick (as outlined here). I plugged it into the NUC, connected my keyboard, connected my monitor, and booted it up. I followed the Ubuntu install process to install Ubuntu on the faster M.2 NVMe drive. Easy.
Begin pain..
Originally I tried connecting to my wireless network using netplan (as outlined here). I couldn't get things to work and was getting weird errors like:
BIOS contains WGDS but no WRDS
YAML config files are very precious about indentation, but everything looked correct.
Obviously using Ubuntu Desktop gives you a GUI to make stuff like this easy. From the command line it is harder. I wanted to install the wireless-tools and network-manager packages to make things easier.
Chicken/Egg problem - I want to install various packages and get everything set up. For example networking packages to connect to the internet. Doing so requires internet access.. This is probably all a lot easier if you have an Ethernet cable (I did not).
I ended up (completely ridiculous I know) booting up an EC2 instance running the same version of Ubuntu server and downloading the packages (as outlined here) that I needed using the following command:
apt-get download $(apt-rdepends network-manager | grep -v "^ " | sed 's/debconf-2.0/debconf/g' | sed 's/time-daemon/chrony/g')I then copied them across on my USB stick to the NUC and installed them:
dpkg -i *.debSome useful commands that I'll note for future reference (source):
#Show saved wifi connections
nmcli c

#List available wifi connections
nmcli d wifi list

#Connect to a network
nmcli d wifi connect <WiFiSSID> password <WiFiPassword> iface <WifiInterface>

#View interfaces
ifconfig -a
Although for future reference nmtui looks good as a visual way of connecting to a wireless network.
I also downloaded an installed the latest BIOS for the NUC from here, as I thought that might have been the cause of some of my issues. It may well have been the cause of the netplan issues, who knows.
Second Hard Drive
The Ubuntu installation process sets up and partitions the install drive as it sees fit (by default). I didn't know any better, so left it to set things up as default.
Now I needed to set up the second drive.
I was aware of Ubuntu Logical Volume Management (LVM) from the servers that run the various products I have built over my career. I have however predominantly used EC2, and Amazon do most of the hard work for you. Furthermore I've never set up a machine with future proofing in mind from the get go.
Ubuntu had set up the M.2 drive as follows:
nvme0n1                   259:0    0  1.8T  0 disk
├─nvme0n1p1               259:1    0  512M  0 part /boot/efi
├─nvme0n1p2               259:2    0    1G  0 part /boot
└─nvme0n1p3               259:3    0  1.8T  0 part
  └─ubuntu--vg-ubuntu--lv 253:0    0  200G  0 lvm  /
It had created a volume group (visible with vgs) called ubuntu-vg the size of the hard drive.
It had created a logical volume (visible with lvs) within that group called ubuntu-lv with a size of 200GB.
I had a play around with expanding the logical volume to 300GB with:
#Expand the Logical Volume
lvresize /dev/mapper/ubuntu--vg-ubuntu--lv -L +100G

#Resize the file system
resize2fs /dev/mapper/ubuntu--vg-ubuntu--lv
I created a real partition on the second disk using fdisk -l.
NOTE: It turns out that you can create a volume group directly onto the whole disk, but the Ubuntu install process used real partitions so I did too.
I then created a new volume group on the single partition of the second disk, second-vg and a second logical volume in that group called second-lv.
I needed to create a filesystem for the logical volume on the second drive but wasn't sure what format Ubuntu was using. I checked this using:
blkid /dev/mapper/ubuntu--vg-ubuntu--lvI had to use the mapper path rather than the path outputted when simply using the lsblk command. I am not 100% sure as to why.
Edit: Turns out lsblk -f is a good way of discerning file system types.
The filesystem was ext4 so I made the new one ext4 too.
I then mounted this logical volume to an arbitrarily named folder - /mnt/ssd using:
mount -t ext4 /dev/mapper/second--vg-second--lv /mnt/ssd
I then added the following to /etc/fstab such that the logical volume is automatically mounted on reboot:
UUID=1234-5678-91011 /mnt/ssd ext4 defaults 0 0Now.. one of the selling points of LVM is that you can combine physical hard drives into the same volume group to have more space to work with. I have chosen to not go this direction because:
- I have read that if one drive dies it can corrupt all the data.
- I want to have two separate drives so that when one dies (assuming a good backup process), I can get things going on the second drive relatively quickly whilst I replace the dead drive.
I have my operating system on the M.2 drive and heavy write data (like nodes) written to the SSD.
If you want to read more on LVM here is a fantastic article on DigitalOcean, here is one from Answertopia, and here is another than I found useful and succinct.
Headless
Next I wanted to make the NUC accessible over SSH so that I could unplug my keyboard and make the machine completely headless. I used my router to assign my NUC a static IP address based on its MAC address, but this can also be done directly using netplan.
Installing Nethermind
Initially I had a play around with building Nethermind from source. It is simple enough to do, but offers little benefit to downloading the prebuilt versions and adds a little confusion/complexity. If you do build it from source yourself the database and config files are found in the locations outlined here.
The easier way is to download the latest version of Nethermind here.
I downloaded the latest version to my server using wget, and defined the configuration parameters (described here) for a Goerli node with metrics (see below) enabled.
I then just run the node with:
./Nethermind.Runner --config goerliRandom Note: If you incorrectly shutdown your node (I accidentally killed my screen instance), you may have to do some clean up including cleaning up various lock files.
find -type f -name 'LOCK' -delete
This was described/explained when I restarted the node (thanks Nethermind team). I only note this as the premise of doing this the long way round was to understand exactly how everything is working. This was a good small issue to work around when restarting the node that could save me time if I ever have issues in production.
Metrics
Nethermind has documentation on setting up Prometheus for monitoring node metrics. I wanted to play around a bit more having not used Prometheus before. My approach is below.
Nethermind connects with Prometheus via pushgateway. Or rather Nethermind sends data to pushgateway which Prometheus then scrapes.
I installed and ran pushgateway as outlined in their README using docker. I've never actually used Docker before, but I know of it, what it does etc. This how-to was extremely useful for me playing around.
docker run -d -p 9091:9091 prom/pushgatewayPrometheus
I am was using Prometheus from a Docker container.
To pass in custom configuration so as to make Prometheus pull data from pushgateway I bind mounted the directory containing my prometheus.yml file to the docker container as outlined here.
docker run -p 9090:9090 -v /home/thomas/prometheus:/etc/prometheus prom/prometheusMy prometheus.yml config file looks like this:
global:
scrape_interval: 5s
evaluation_interval: 5s
scrape_configs:
- job_name: 'pushgateway'
honor_labels: true
static_configs:
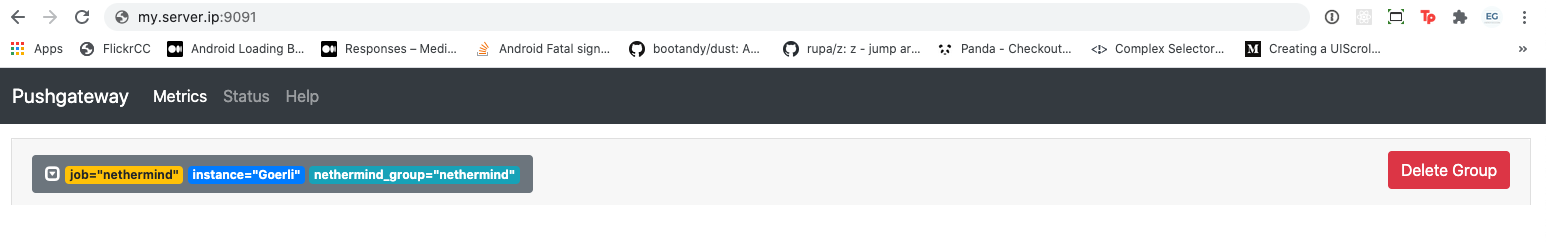
- targets: ['server.ip.address:9091']To check that data is being sent to the push gateway correctly you can visit my.server.ip:9091 and you should see something similar to below:
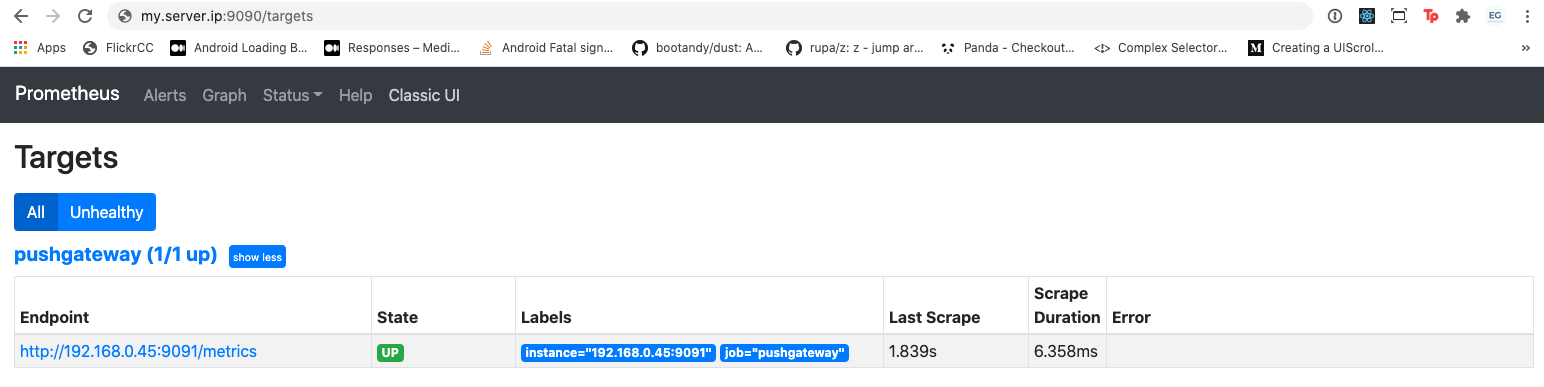
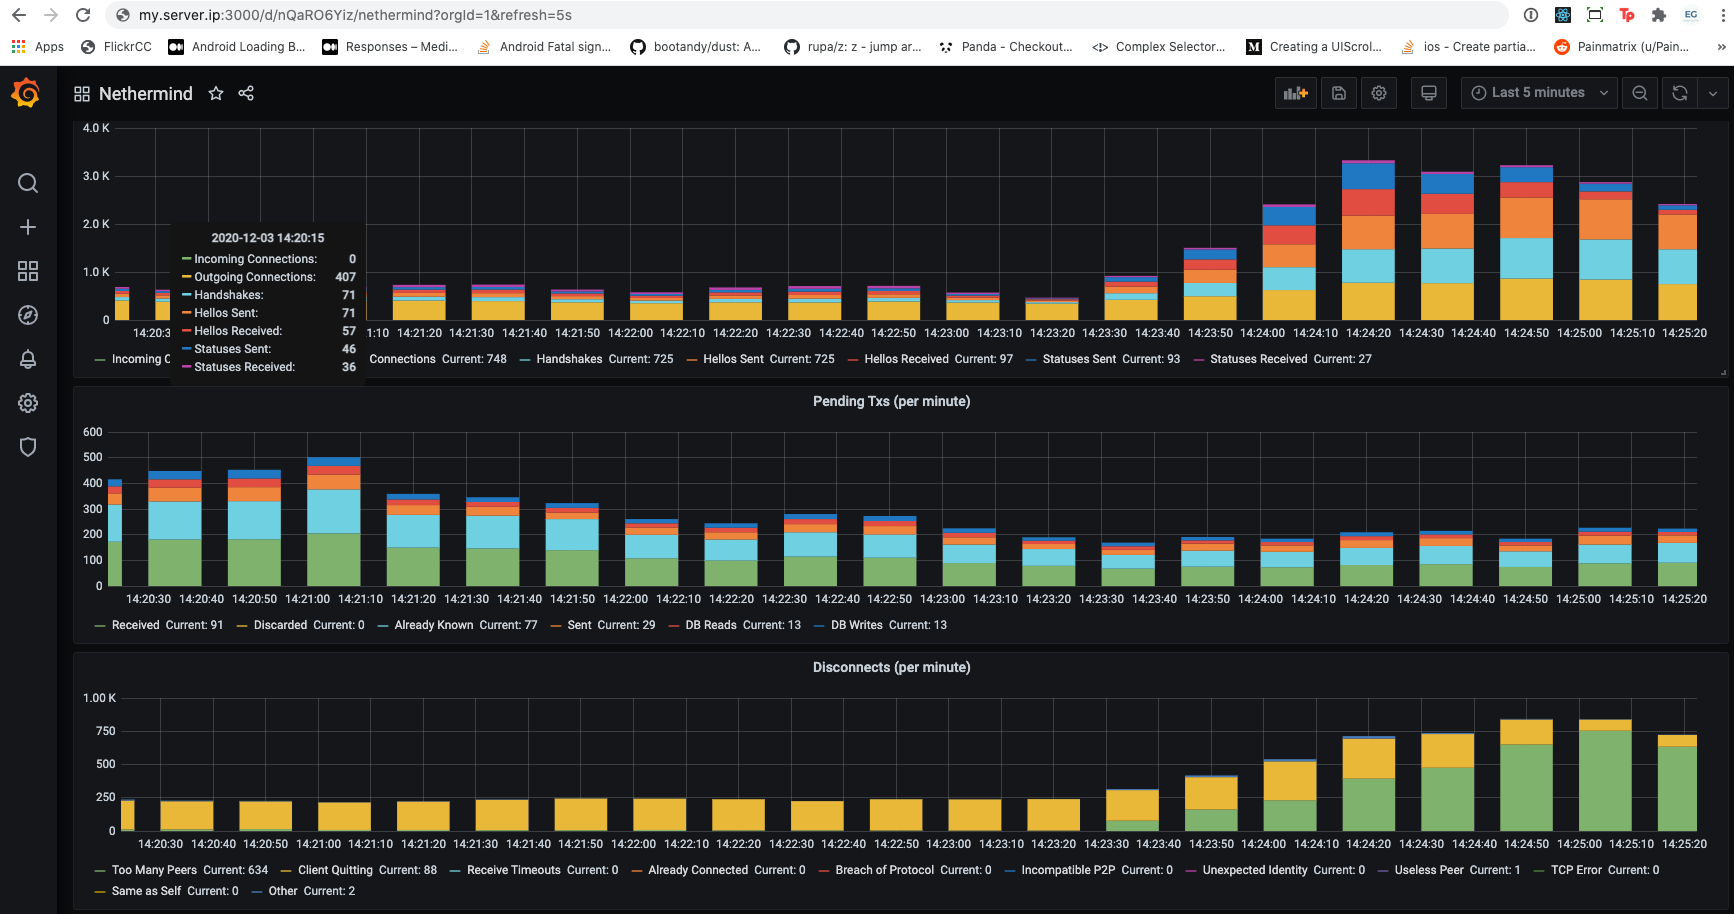
If Prometheus is successfully scraping that data you should see something like:
EDIT: After completing this setup and writing this blog post I was looking for weak points in the system. I noted that I was hard coding my server IP in a lot of places which makes for a setup that is not system agnostic.
I wanted to just replace static coded IP addresses with 127.0.0.1 or localhost, but this gets a bit complex with docker as those addresses don't necessarily point to where you want them to point.
There are possible workarounds but it makes the system more complex and I was finding that past a point it was making things confusing. I figured it was worth avoiding docker completely, and installing Prometheus directly on the server.
This also has the added benefit that you can run it automatically with systemd in line with the rest of the setup.
I did this in the same way as Somer Esat:
useradd --no-create-home --shell /bin/false prometheus

#Create Directories
mkdir /etc/prometheus
mkdir /var/lib/prometheus

#Set directory ownership. The prometheus account will manage these.
chown -R prometheus:prometheus /etc/prometheus
chown -R prometheus:prometheus /var/lib/prometheus

#Download Prometheus software
wget https://github.com/prometheus/prometheus/releases/download/v2.23.0/prometheus-2.23.0.linux-amd64.tar.gz

#Unpack the archive. It contains two binaries and some content files.
tar xvf prometheus-2.20.0.linux-amd64.tar.gz

#Copy the binaries to the following locations.
cp prometheus-2.20.0.linux-amd64/prometheus /usr/local/bin/
cp prometheus-2.20.0.linux-amd64/promtool /usr/local/bin/

#Set directory ownership. The prometheus account will manage these.
chown -R prometheus:prometheus /usr/local/bin/prometheus
chown -R prometheus:prometheus /usr/local/bin/promtool

#Copy the content files to the following locations.
$ sudo cp -r prometheus-2.20.0.linux-amd64/consoles /etc/prometheus
$ sudo cp -r prometheus-2.20.0.linux-amd64/console_libraries /etc/prometheus

#Set directory and file (-R) ownership. The prometheus account will manage these.
$ sudo chown -R prometheus:prometheus /etc/prometheus/consoles
$ sudo chown -R prometheus:prometheus /etc/prometheus/console_libraries
Setup Prometheus as a service:
vi /etc/systemd/system/prometheus.service[Unit]
Description=Prometheus
Wants=network-online.target
After=network-online.target
[Service]
Type=simple
User=prometheus
Group=prometheus
Restart=always
RestartSec=5
ExecStart=/usr/local/bin/prometheus \
--config.file /etc/prometheus/prometheus.yml \
--storage.tsdb.path /var/lib/prometheus/ \
--web.console.templates=/etc/prometheus/consoles \
--web.console.libraries=/etc/prometheus/console_libraries
[Install]
WantedBy=multi-user.targetIf you want to collect server metrics you can do so with node_exporter.
Install it and run it as a service as follows:
wget https://github.com/prometheus/prometheus/releases/download/v2.23.0/prometheus-2.23.0.linux-amd64.tar.gz

tar xvf prometheus-2.23.0.linux-amd64.tar.gz

cp node_exporter-1.0.1.linux-amd64/node_exporter /usr/local/bin

chown -R node_exporter:node_exporter /usr/local/bin/node_exporter
vi /etc/systemd/system/node_exporter.service[Unit]
Description=Node Exporter
Wants=network-online.target
After=network-online.target
[Service]
User=node_exporter
Group=node_exporter
Type=simple
ExecStart=/usr/local/bin/node_exporter
[Install]
WantedBy=multi-user.targetGrafana
Again, I installed Grafana in a similar manner to that outlined in Somer Esat's guide (although that pertains to setting up a dashboard for a beacon node).
wget -q -O - https://packages.grafana.com/gpg.key | sudo apt-key add -

#Add the Grafana repository to the APT sources.
sudo add-apt-repository "deb https://packages.grafana.com/oss/deb stable main"

#Refresh the apt cache.
sudo apt update

#Make sure Grafana is installed from the repository.
apt-cache policy grafana
sudo apt install grafana

#Start the Grafana server and check the status to make sure it’s running correctly.

sudo systemctl start grafana-server

sudo systemctl status grafana-server

#Enable Grafana to start on boot.
sudo systemctl enable grafana-server
You then have to login to the Grafana dashboard, add Prometheus as a data source, and then create a dashboard.
NOTE: Nethermind also have a guide for setting up Nethermind with a monitoring stack using terraform. I've never used Terraform, and on having a brief look it looks like it automates preconfigured setup of a server environment. In this example it sets up a Nethermind node, and monitoring stack on DigitalOcean. I chose not to use this as I wanted a full understanding of what was being setup (and how) such that I could update components as/when needed without hiding the details.
That said, I found the JSON for the Nethermind dashboard used as part of their terraform process on Github, and used it for my dashboard.
Graphing Server Metrics
Having set up node_exporter to pass data about our server to Prometheus we probably want to process and graph this data in Grafana.
I couldn't immediately find a guide that outlined how to do this.
A quick Google search linked me to this dashboard that can be imported in Grafana to visually display all the imported data.
Setting up ETH2
Lighthouse
Lighthouse from Sigma Prime contains both beacon node software and software to run validator(s).
I installed it as follows:
- Install Rust
curl --proto '=https' --tlsv1.2 -sSf https://sh.rustup.rs | sh

source $HOME/.cargo/env- Install required packages
sudo apt install -y git gcc g++ make cmake pkg-config libssl-dev- Clone the latest stable release of lighthouse:
git clone -b v1.0.3 https://github.com/sigp/lighthouse.git- Build it:
cd lighthouse

make
Generating Validator Keys
Next we need to generate validator keys.
- Find the latest release of eth2.0-deposit-cli, and download it:
wget https://github.com/ethereum/eth2.0-deposit-cli/releases/download/v1.1.0/eth2deposit-cli-ed5a6d3-linux-amd64.tar.gz- Unzip it:
dd- Generate validator keys using:
./deposit new-mnemonic --num_validators 1 --mnemonic_language=english --chain pyrmont- Follow the in terminal instructions and your keys will be generated.
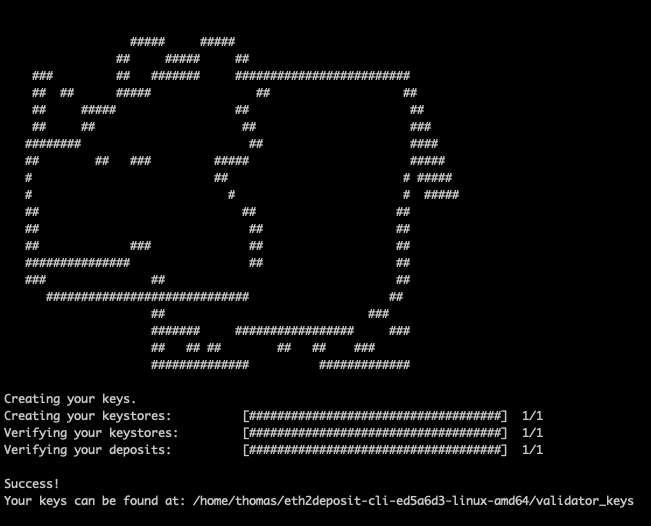
NOTE: Remember you keystore password and mnemonic. Back them up.
The files that the CLI creates are:
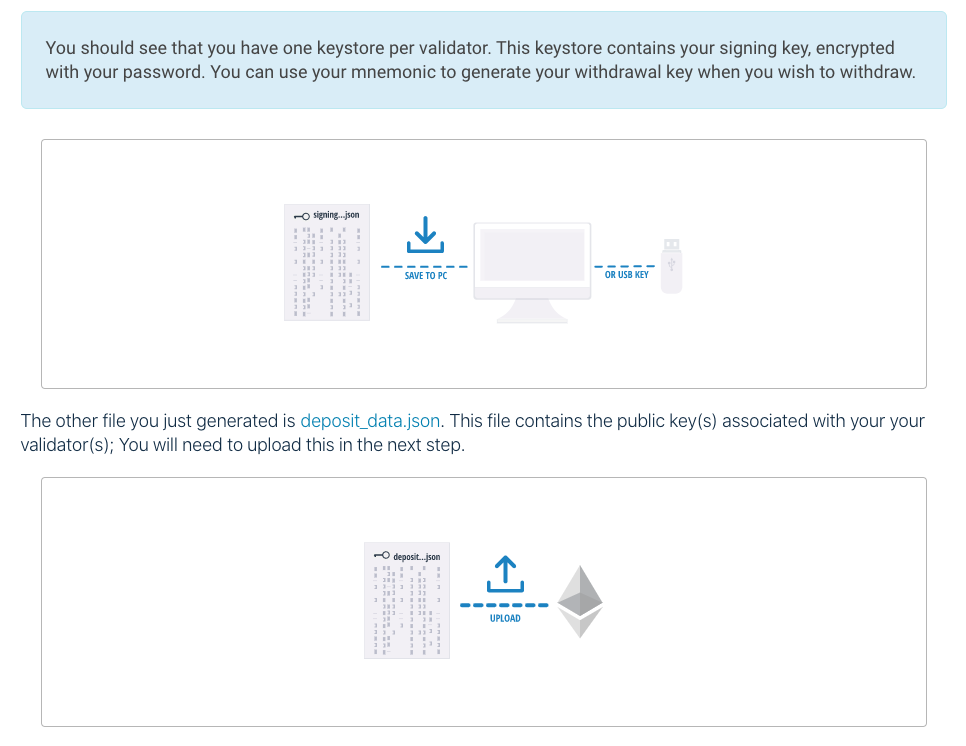
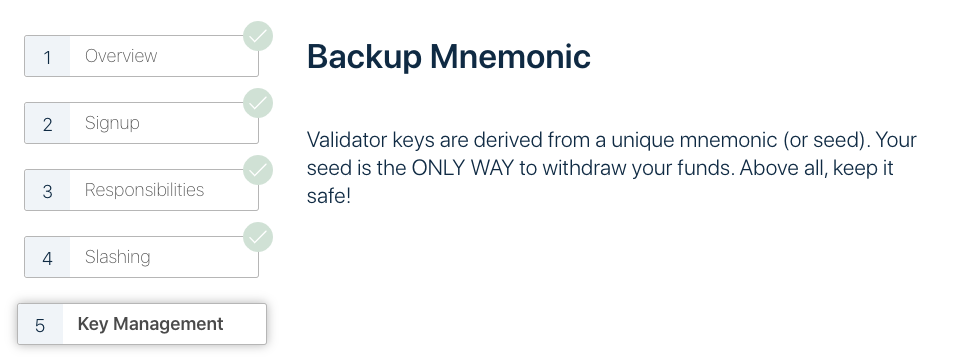
The above screenshots are from the Pyrmont Launchpad which will guide you through this process explaining all the risks, and the general process.
If you are using Metamask it integrates directly such that you can complete the process step by step in your browser.
NOTE: As this is on the testnet I followed the process and used Metamask. More advanced users might want to sign their own transactions on an offline computer and send them raw and/or use a hardware wallet like Ledger.
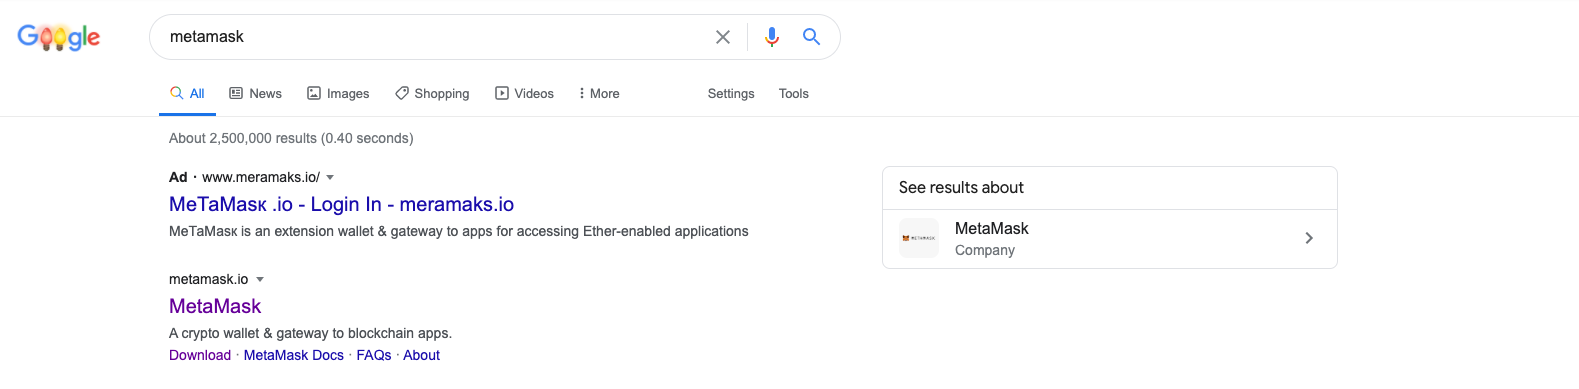
NOTE: As always, watch out for Phishing scams. There are sponsored ads for fake Metamask on Google for example.
Make sure you are sending your ETH to the correct deposit contract, and make sure that if you are intending to work on a testnet that you are using a testnet account.
Now, If you visit https://pyrmont.beaconcha.in/ and enter the Goerli ETH1 address that you sent the deposit from you will see
Clicking on the validator hash will display its status:
Given that the beacon chain networks have launched both on Pyrmont and Mainnet, your validator will not be added immediately. In this case it suggests it will take more than 12 hours.
On Mainnet the time it takes depends on the number of validators waiting to be added in the queue in front of you.
This is the time to finalise your validator setup and get it running. If it is not up when your validator is added you may lose money.
Beacon Chain / Validator Setup
Quite a lot of this was influenced by Somer Esat's approach. I'm not trying to reinvent the wheel here - his setup is great.
I have copied the appropriate code snippets just to have everything referenced in one place.
I do have some different naming conventions, I tend to use vim instead of nano, and I have organised my data directories somewhat differently in a way that works best for me.
- Make sure your timezone is setup correctly. I changed mine to Europe/London (it was UTC by default).
timedatectl set-timezone "Europe/London"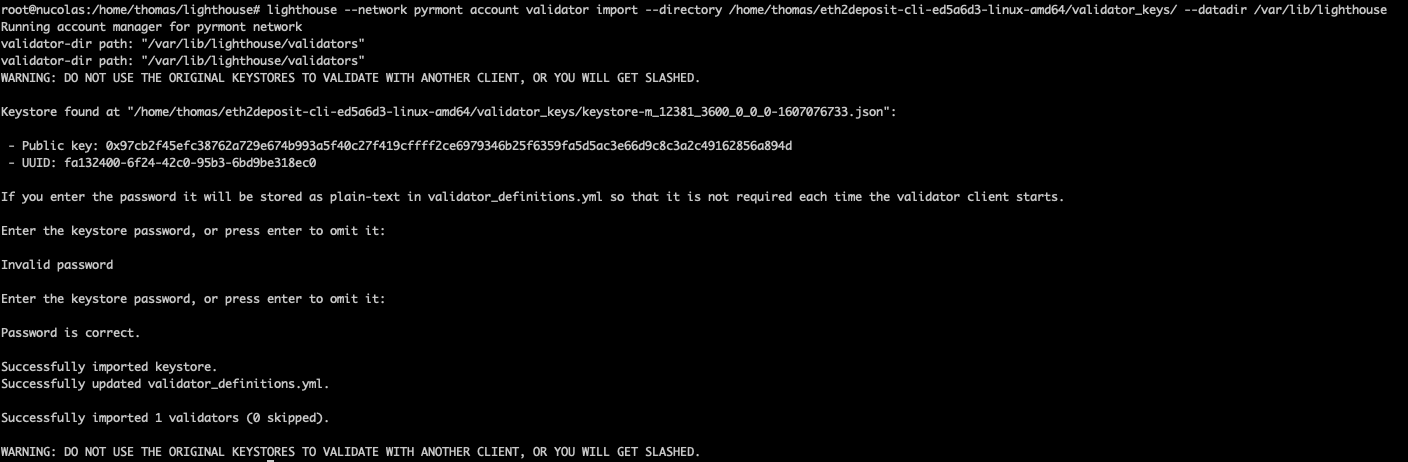
- Create some new users:
useradd --no-create-home --shell /bin/false lighthouse-beacon

useradd --no-create-home --shell /bin/false lighthouse-validator- Make your data directories:
mkdir -p /mnt/ssd/lighthouse-beacon-data

mkdir -p /mnt/ssd/lighthouse-validator-data- Make your new users owners of those data directories:
chown -R lighthouse-beacon:lighthouse-beacon /mnt/ssd/lighthouse-beacon-data/

chown -R lighthouse-validator:lighthouse-validator /mnt/ssd/lighthouse-validator-data/- Import your validator keys:
lighthouse --network pyrmont account validator import --directory /home/thomas/eth2deposit-cli-ed5a6d3-linux-amd64/validator_keys/ --datadir /mnt/ssd/lighthouse-validator-data- I like Somer's approach of moving the Lighthouse binaries and then simply copying over updated versions when updating:
cp /$HOME/.cargo/bin/lighthouse /usr/local/bin- Setup running the beacon node as a
systemdservice
vi /etc/systemd/system/lighthouse-beacon.service[Unit]
Description=Lighthouse Beacon Node
Wants=network-online.target
After=network-online.target
[Service]
Type=simple
User=lighthouse-beacon
Group=lighthouse-beacon
Restart=always
RestartSec=5
ExecStart=/usr/local/bin/lighthouse beacon_node --datadir /mnt/ssd/lighthouse-beacon-data --network pyrmont --staking --eth1-endpoint http://127.0.0.1:8545 --metrics
[Install]
WantedBy=multi-user.targetsystemctl daemon-reloadsystemctl start lighthouse-beacon
systemctl status lighthouse-beacon- Enable it to run on start up
systemctl enable lighthouse-beacon- Monitor its status
journalctl -fu lighthouse-beacon.service- Setup the validator client as a
systemdservice
vi /etc/systemd/system/lighthouse-validator.service[Unit]
Description=Lighthouse Validator
Wants=network-online.target
After=network-online.target
[Service]
Type=simple
User=lighthouse-validator
Group=lighthouse-validator
Restart=always
RestartSec=5
ExecStart=/usr/local/bin/lighthouse validator_client --network pyrmont --datadir /mnt/ssd/lighthouse-validator-data --graffiti "ThOmAs"
[Install]
WantedBy=multi-user.targetsystemctl start lighthouse-validator
systemctl status lighthouse-validator- Monitor its status
journalctl -fu lighthouse-validator.service- Enable it to run on startup
systemctl enable lighthouse-validatorNOTE: I tend to monitor my various running services in different tabs of a perpetually running screen instance that I can quickly reattach when I SSH into the server. Here is a screen cheatsheet to get you started.